
How to Arrange Data Flows, Analytics, and Interfaces for DER Integration Using Entropy Reduction and Laminar Structure
Multiscalar analytics and where to put standardized interfaces for DER telemetry.

Information theory is a bit slippery to understand but it provides powerful insights, not just for data flow scalability, but also for telemetry interface specification. I have written previously about how to think about data flows using Shannon entropy, but here I want to get practical about the implications for 21st Century power grids.
Background
Let’s recall a few basic facts and then apply them to DER telemetry. There is math behind all this but as usual we will not need to solve any equations. The shy genius Claude Shannon1 provided the foundation of information theory and telecommunications with (among other things) his definition of information entropy:
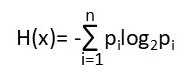
Basically, this equation quantifies the “disorder” of a data set (its entropy - essentially the uncertainty in the representation of the information about a random variable). It quantifies the average number of bits (when using base 2 logarithms) required to encode the state of the underlying random variable.

We are going to adapt this idea as the basis for some very practical grid architectural structure. If a data set has more bits than the number needed to represent the actual information, then we have an opportunity to reduce the data volume while preserving the information. The data reduction can be done using data analytics, which are defined as data transformations that reduce Shannon entropy. In practice, this means aggregating2 raw (incoming) data and then extracting the relevant information, which results in a data volume reduction (see Figure 1). Note that we are not talking about data compression since there is no intention to expand back to the original data set.
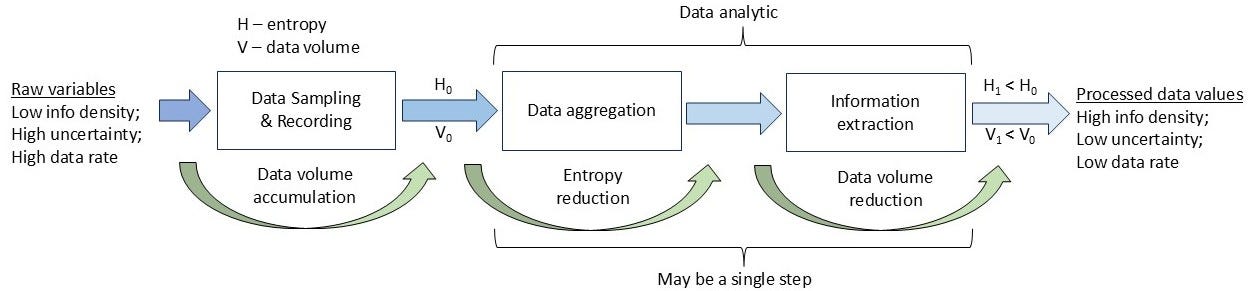
This is not really very mysterious in practice. Consider, for example, converting a set of AC voltage samples into an RMS voltage value. We may use, say, 256 16-bit samples per cycle for two cycles of an AC voltage waveform to create one 32-bit value of RMS voltage per cycle pair. The original data set contains the information about RMS voltage, but spread over 8,192 bits, whereas the extracted RMS value needs only 32 bits to represent it. By aggregating samples, the uncertainty in the voltage RMS value is reduced, resulting in decreased entropy, allowing for a reduced data volume representation of the extracted information (calculation of the RMS value in this case). We can think of an analytic as having two parts: aggregation and extraction, although they may both be accomplished in a single step.
Starting from this basis, we can treat DER telemetry data flows in an organized fashion for purposes of scalability and also define key functionality of grid telemetry interfaces.
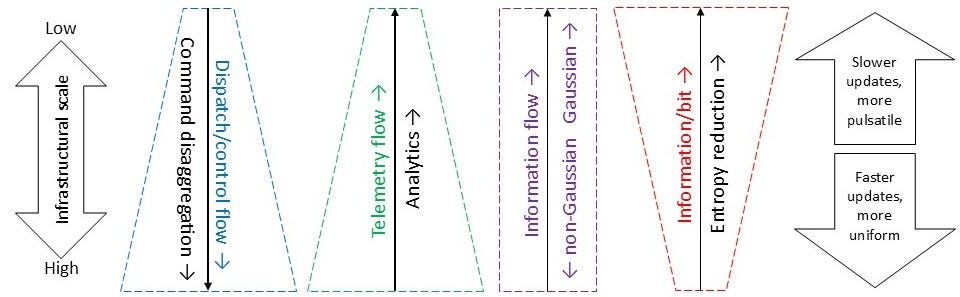
In fact, applying Laminar structure combined with the entropy reduction principle yields a number of useful architectural and systemic insights, as Figure 2 above illustrates. Not only are DER telemetry data volumes affected as functions of infrastructural scale, but so are telemetry statistics3 and system dynamics. Notice that this logical dataflow structure mirrors the Laminar coordination structural command disaggregation model, albeit with flow in the opposite direction.
Application to High-DER Power Grids
So how does this help us deal with DER data flow scaling? If we apply the entropy-reducing data analytic concept combined with Laminar coordination, we can devise a multiscalar structure for DER telemetry management that delivers information to each level as needed without the scaling problem of centralizing all the raw data. See Figure 3 below.
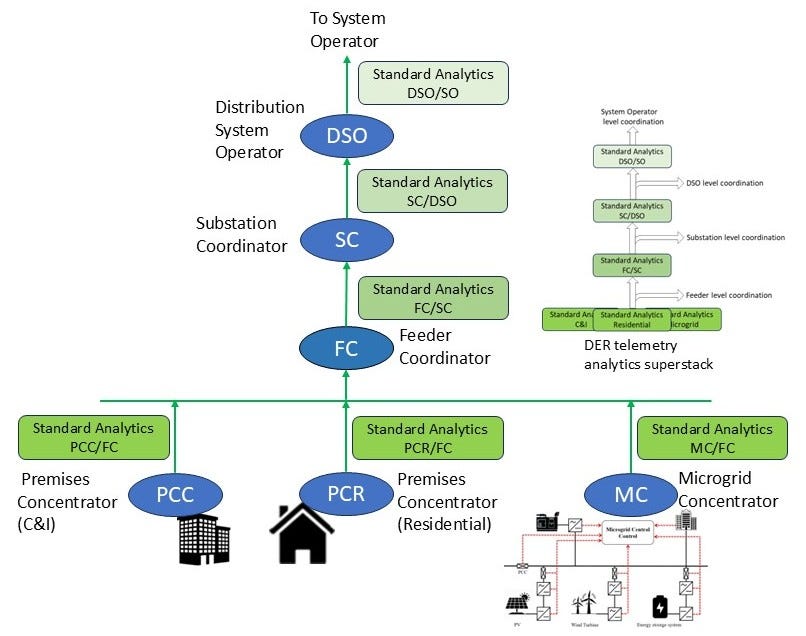
This structure determines the locations and essential functions of ten interface types, as well as six analytics stack types that support the interface functions and thereby support the distributed DER telemetry functionality.
From the bottom up in Figure 3:
Level 1- Domain Concentrators
The Domain Concentrators perform entropy/volume reduction on the telemetry from the devices within their domains (premises, microgrids, etc.) and present the resultant information to the appropriate Feeder Coordinator. Each Domain Concentrator has one northbound interface, one standardized analytics stack (per domain type), and any southbound interfaces necessary to connect to the various devices and systems that may exist within each domain.
Level 2/3 - Feeder/Substation Coordinator Nodes
The Feeder Coordinator performs entropy/volume reduction on the telemetry from the domain concentrators in its service area and presents the resultant information to the Substation Coordinator. The Feeder Coordinator has one northbound interface, one standardized analytics stack, and sufficient instances of its southbound interface to receive the information from as many Domain Concentrators as necessary.
The Substation Coordinator performs entropy/volume reduction on the telemetry from the feeder coordinators in its service area and presents the resultant information to the DSO. The Substation Coordinator has one northbound interface, one standardized analytics stack, and sufficient instances of its southbound interface to receive the information from as many feeders as the substation has.
Level 4 - DSO/SO
The Distribution System Operator, in conjunction with the host Distribution Network Operator, performs entropy/volume reduction on the telemetry from the substation coordinators in its service area and presents the resultant information to the System Operator. The DSO has one northbound interface, one standardized analytics stack, and sufficient instances of its southbound interface to receive the information from as many substations as there are in its distribution system.
Of course, the System Operator has sufficient instances of its southbound interface to receive the DSO information from as many DSOs as there are in the system. Also, at each level, coordinators may exchange aggregated information with its peers.
Summary
The model of Figure 3 defines a multiscalar analytics structure, based on Laminar coordination framing and entropy reduction. The set of six analytics stack types defines a telemetry analytics superstack. Each of the interface types and analytics stacks can be standardized and used across the entire power system. This structure forms a multi-layer platform, which provides DER telemetry scalability, system decoupling and resilience (see also the Layering and Platforms discussion in Section 5.2 of the Grid Architecture Cookbook). The approach described above is used now to some extent, but it can be formalized into an actual architectural approach that determines structure, components (concentrators, coordinators, and analytics stacks), interface locations and functions, and also informs standards. This layered, distributed structure is inherently more resilient and scalable than the massive centralized database/data-mining approach.
Caveats
This model is simplified in that it does not show the effects of aggregators/VPPs and cloud services of the equipment vendors4 but these can be accommodated. More about that another time.
The model describes idealized logical telemetry flows, not physical network data packet flows. Physical communications networks and data flows do not necessarily comport with these diagrams and that is both bad news and good news. The bad news is that communications connectivity varies considerably from location to location and can be quite unreliable for a number of reasons. Actual packet flows over real communications networks can take time-changing variable-latency paths that can be much less direct that the idealized figure above shows. Electric utilities may own and operate some distribution communication networks but may rely upon commercial internet for connections to residential and commercial/industrial premises. Consequently, the communications and computation platforms for feeder coordinators may5 or may not exist on distribution grids.
The good news is that virtualization can be used to provide the feeder coordinator functions either within the substation in conjunction with the substation coordinator, or at some other location, provided the communications networks can support them. More about that later, too.
In addition to developing information theory and sampling theory, he was the first to describe the use of Boolean Algebra for the design of logic circuits, laid foundations for symmetric key cryptography, and introduced the word “bit” for binary digit. He also did work on genetics and artificial intelligence, and was a co-inventor of pulse code modulation. Plus, he was a accomplished juggler.
The term aggregation is used many different ways. In communications it can mean just agglomerating data packet streams into large flows. Here we mean combining data samples in some form that treats them as a related group, not just a bunch of samples. A simple example would be summing the sample values. Generally we are doing something more sophisticated than that, although at some levels, summation is, in fact, the useful analytic.
Statistics of telemetry data at the DER level are non-Gaussian, but as we move toward the lower end of the infrastructural scale (or upward in Figure 3), the use of data analytics causes the statistics of the telemetry data to converge toward Gaussian, due to central limit theorem effects at the lower levels, and the arithmetic of random variables at the higher levels of Figure 3.
In the US, the only way to access some behind-the-meter devices such as thermostats and solar/battery inverters is via the equipment makers’ clouds.
The concept of a pole-mountable field area router/computing platform was invented at SCE and Cisco Systems subsequently developed a product meeting this need.